A Comprehensive Cost–Benefit, Fiscal Impact, and Risk Assessment of the Kaskida Offshore Development
Written by David Mullins, Matthew Conley, Akachukwu Oguine, and Gabriel Wooden
SUMA PS5020 Cost-Benefit Analysis Final Report - Fall 2025
Advised by Dr. Anyi Wang
Executive Summary
The Kaskida project is a proposed deepwater offshore oil production initiative in the Gulf of Mexico spearheaded by BP. This cost-benefit analysis investigates whether the project’s economic, fiscal, and environmental outcomes collectively justify its pursuit. We evaluate the project from the perspective of BP, the United States government, and U.S. consumers, and compare these outcomes to the counterfactual of leaving the resource undeveloped.
Drawing on detailed estimates of domestic oil market impacts, federal fiscal revenues, extraction and decommissioning costs, and low-probability environmental risks, we find that the project yields a positive net present value (NPV) of approximately $866 million (2025 USD) and a benefit-cost ratio (BCR) of 1.07. All figures are discounted to 2025 USD using a 2% social discount rate, consistent with U.S. federal cost-benefit analysis guidance (OMB, 2023). Under these assumptions, the project remains economically viable until its internal rate of return (IRR) falls to 4.77%.
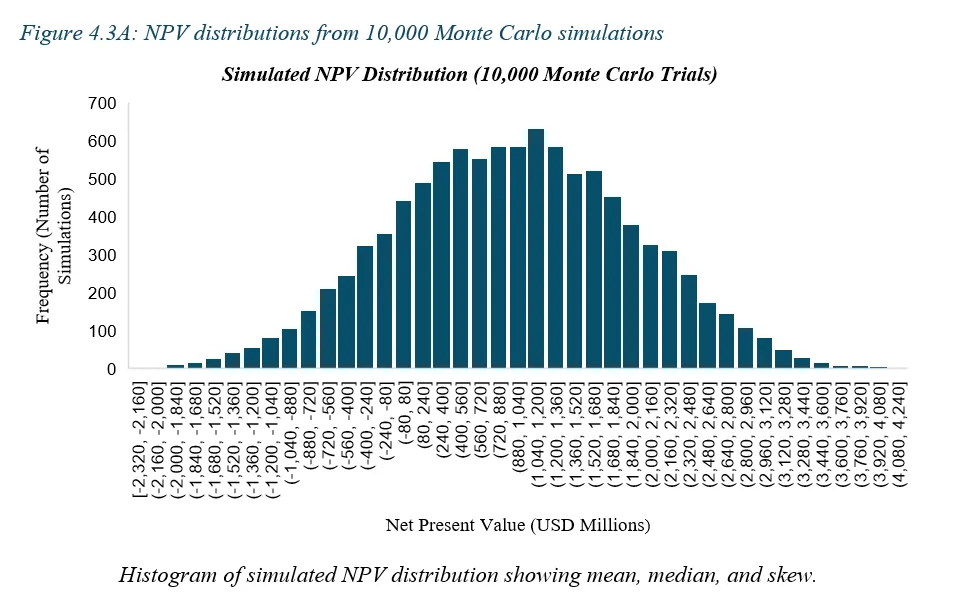
To assess the robustness of our estimates, we conducted a sensitivity analysis to examine how the NPV responds to variations in key parameters—including oil prices, plateau duration, decline rates, royalty and tax rates, and the taxable share of profits. The change in price from increased oil supply proved to be the largest NPV driver, yielding an overall NPV swing of ±$3.1 billion. A 10,000-trial Monte Carlo simulation further indicated an 81.5% probability that the project’s NPV is positive, with only mild left-tail downside risk. Taken together, these results demonstrate that the project’s net benefits are resilient across a wide range of plausible market and policy conditions, supporting the case for proceeding provided that safety and environmental safeguards are rigorously enforced.
1. Introduction and Background
1.1 Context & Field Overview
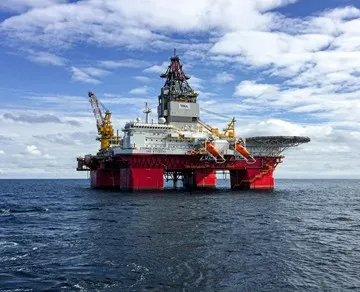
The Kaskida well lies roughly 250 miles offshore in the Gulf of Mexico, at a water depth of about 6,000 feet (Perkins & Spencer, 2024). Its ultra-deepwater location requires high-pressure drilling systems, subsea completions, and long-distance tiebacks, all of which increase engineering complexity and development cost. BP anticipates a five-year development period involving substantial capital expenditures.
BP has not disclosed a full cost breakdown, but public reporting indicates that total development expenditures are expected to be approximately $5 billion (Perkins & Spencer, 2024). First oil is scheduled for 2029, ramping up to a plateau rate of roughly 80,000 barrels per day (BP Press, 2024).
Although 80,000 barrels represent only around 0.08% of global daily oil production (~100 million barrels per day in 2023; EIA, 2024), the field is still economically significant due to its size and longevity. Kaskida is one of the largest undeveloped deepwater discoveries in the Gulf of Mexico, giving it strategic value for domestic supply, long-run production stability, and federal energy-security planning.
1.2 Standings and Counterfactual
The central research question of this CBA is: Does development of the Kaskida reservoir generate greater net social value for the United States than the counterfactual of leaving the field undeveloped?
In addressing this, we adopt the standing of BP and the United States—including the federal government and U.S. residents—as the relevant affected parties. We therefore include only costs and benefits that materially affect both of these groups. This avoids double-counting and allows us to treat BP’s capital and operating expenditures as resources that could otherwise be deployed to alternative projects. Environmental externalities—spill risk and emissions damages—are shared by both BP stakeholders and the U.S. public, making their inclusion consistent with this standing.
Under the counterfactual scenario, the oil remains in situ, generating no fiscal revenues, consumer welfare gains, or domestic production benefits for the U.S. economy. Global oil prices remain marginally higher without Kaskida’s incremental supply, and the federal government foregoes royalties and corporate tax receipts. At the same time, all extraction-related environmental costs—GHG emissions, spill risk, and eventual decommissioning—are avoided entirely.
This “untapped resource” baseline provides a transparent and policy-neutral benchmark. Because no publicly available evidence identifies a comparable alternative BP investment opportunity, introducing a hypothetical substitute would add unnecessary speculation. Comparing Kaskida directly to the undeveloped state thus offers the clearest basis for assessing its net social value under the standing defined in this CBA.
1.3 Scope & Time Horizon
Pre-production for this well began in 2025 and is projected to continue until 2028, with first oil expected in 2029 (BP Press, 2024). To estimate the project duration, this report divides the field’s 275 million estimated recoverable barrels available by the daily output of 80,000 barrels, implying roughly 9.4 years of steady-state production. To accommodate ramp-up, plateau, and decline phases, this report adopts an 11-year operational horizon (2029–2040).
Note: All tables, figures, and supplementary materials referenced in the main text are compiled in the Appendix.
2. Methodology
2.1 Project Impacts: Costs & Benefits
As stated, we only include costs and benefits that are impactful to both members of our standing—BP and the United States. This section explains why each category is included in the CBA; the methods used to value them are detailed in Section 2.2.
2.1.1 Costs
We include BP’s capital, operations, maintenance, and insurance expenditures as they represent real resource uses. Under our standing, these expenditures are social opportunity costs: funds BP could otherwise deploy toward alternative investments. Excluding them would overstate the net benefits of development.
Environmental externalities are incorporated as they impose direct burdens on the U.S. public. GHG emissions have well-documented economic, health, and environmental damages, making them a genuine social cost borne by U.S. residents. Catastrophic spill risk is also included given that deepwater drilling combines low-probability with extremely high-impact consequences. A spill would result in cleanup, ecological, and financial losses shared by BP and U.S. stakeholders. Omitting this risk would therefore understate the true expected cost of extraction.
Decommissioning costs are included based on federal offshore regulations requiring full site restoration. The BOEM (2020) classifies these obligations as real economic resource uses rather than transfers.
2.1.2 Benefits
These benefit categories are included as they generate fiscal gains or welfare improvements for both U.S. residents and BP under our standing. Federal royalties and corporate tax revenues constitute fiscal inflows to the U.S. government, representing public returns from resource extraction on federal lands rather than circular transfers within BP. Their inclusion therefore reflects the government’s share of value generated by the project.
Consumer-surplus gains are also treated as a core benefit, since U.S. households experience welfare improvements from lower crude-oil prices resulting from Kaskida’s incremental supply. Even modest price reductions produce meaningful aggregate gains when applied across national consumption volumes. This treatment is consistent with federal CBA guidance, which recognises price-linked welfare changes accruing to U.S. households.
BP’s post-tax profits are not added as a separate benefit, as doing so would double-count value already captured through producer-side fiscal flows, such as royalties, corporate income taxes, and profit-sharing, that accrue to the U.S. government under our standing. Other non-quantified effects—including employment outcomes, macroeconomic spillovers, local operational impacts, and long-run energy-security gains—are acknowledged but omitted due to insufficient parameterisation. Their exclusion is discussed further in Section 5.1.
Adjustments for inflation, decline rates, tax pass-through, and avoided transfers follow federal CBA guidance and are implemented in Section 2.2.
2.2 Estimation methods
This section documents how each major cost and benefit component is translated into annual monetary cash flows in 2025 USD, and how these flows are aggregated to form the present values of costs and benefits reported in Section 3. For each component, we set out the core formula, the key parameter values, and the external sources underpinning those assumptions.
2.2.1 Costs
2.2.1.1 Capital and operating expenditure (CAPEX and OPEX)
Total development CAPEX for Kaskida is assumed to be $5.0 billion (2025 USD), based on publicly available engineering cost reporting (Perkins & Spencer, 2024). Consistent with offshore field-development practice, CAPEX is allocated over the four-year pre-production period using a progressive S-curve profile (Merrow, 2011; OGA, 2018; NORSOK, 2013). Accordingly, we apply a representative 10%–20%–30%–40% distribution across Years −3 to 0. If K denotes total CAPEX and st the share incurred in year t, annual capital spending is:

Historical deepwater OPEX for similar 80 kbopd Gulf projects averaged ~$210 million/yr, and NOIA reports a ~50% decline in Gulf operational costs since 2014 (NOIA, 2023). Applying this reduction yields a plateau OPEX estimate of ~$100 million/yr for Kaskida.
2.2.1.2 CO₂ emissions (lifecycle climate damages)
Lifecycle CO₂ emissions from combustion of Kaskida crude are monetized using the U.S. federal Social Cost of Carbon (SC-CO₂). The emissions factor for petroleum products is drawn from EPA and EIA greenhouse gas inventory guidance, which suggests around 0.104 tCO₂ per barrel of refined product (EPA, 2014; EIA, 2024).
If annual incremental production in year t is Qt barrels, annual emissions are:
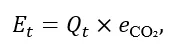
where eCO2 is the emissions factor (tCO₂/bbl).
We adopt an SC-CO₂ of $236/tCO₂ in 2025 USD for the central case, consistent with recent U.S. EPA 2023 updates to the social cost of greenhouse gases and associated tools that scale the federal estimates into 2020–2025 price levels (EPA, 2023; Cost of Carbon, 2024).
Annual climate damages in year t are therefore:
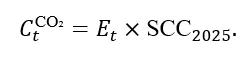
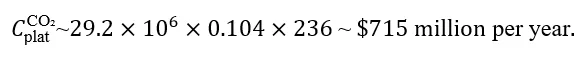
For example, in a representative plateau year, Kaskida produces 80,000 bbl/day, or roughly 29.2 million barrels per year. With eCO2 ~0.1 tCO₂/bbl and SCC2025 = $236/tCO₂, the annual climate damage is on the order of:
2.2.1.3 Catastrophic spill expected cost
Low-probability, high-impact spill risk is proxied by scaling the Deepwater Horizon (DWH) disaster to Kaskida. National Commission on the BP Deepwater Horizon Oil Spill 2011 reports suggest BP’s total DWH liabilities reached more than $190 billion (2025 USD).
Let:
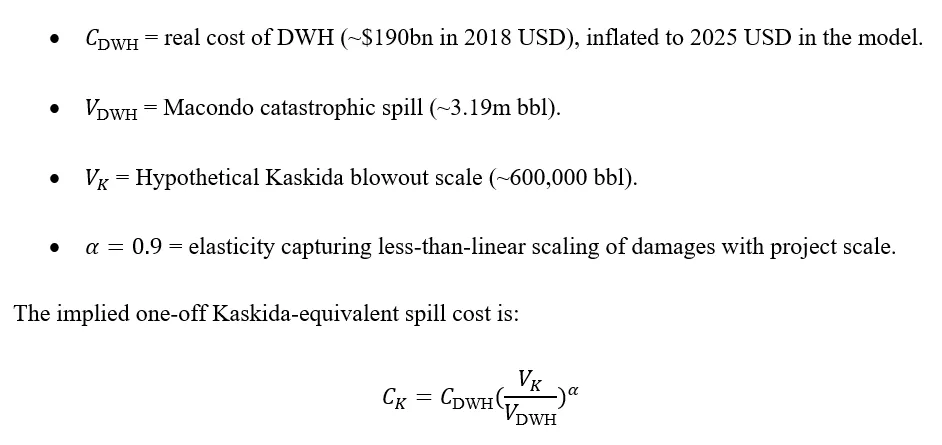
This formulation produced a Kaskida spill damage estimate of roughly $42.2 billion in 2025 USD. Given the rarity of DWH-scale events, we apply a small annual probability pspill (⁓5 x 10⁻⁵ per year) based on deepwater blowout risk statistics, so the expected annual spill cost is:
This constant expected cost is applied over the operating phase and discounted; it makes a modest but conceptually important contribution to environmental costs.
2.2.1.4 Decommissioning
Decommissioning is modelled as a terminal cost equal to 9.4% of total CAPEX, consistent with industry estimates of decommissioning costs for offshore oil fields as a share of initial investment in North Sea and Gulf of America contexts (BOEM, 2020).
With total CAPEX K = $5.0 billion, the undiscounted decommissioning cost is:
Incurred in the final year of the project and discounted back at the social discount rate.
2.2.2 Benefits
2.2.2.1 Fiscal benefits: royalties and corporate income tax
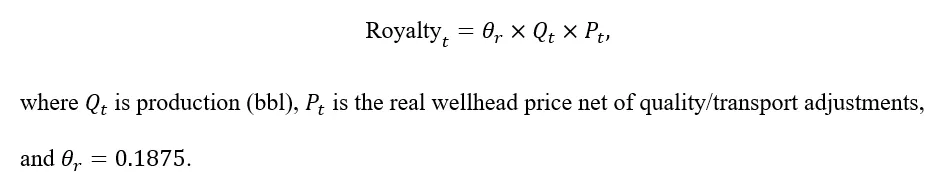
Royalties
Under U.S. federal offshore leasing, deepwater Gulf of America tracts have historically attracted royalty rates up to 18.75% of the gross value of production (BOEM, 2020; S&P Global, 2020).
For each year t,
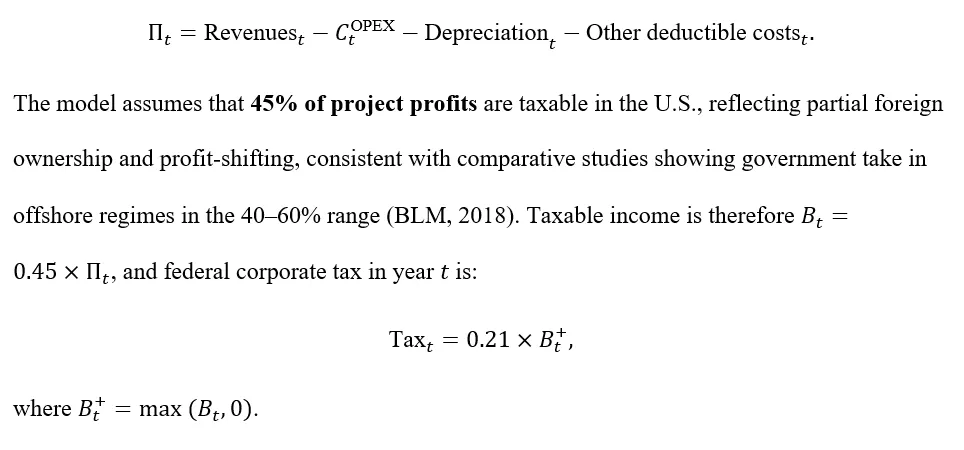
Corporate income tax
Since the Tax Cuts and Jobs Act, the U.S. federal corporate income tax rate has been 21% (Tax Policy Center, 2018; PwC, 2025).
Let pre-tax project profits in year t be:
2.2.2.2 Consumer surplus gains from lower oil prices
Kaskida’s incremental output slightly increases global supply and lowers the world oil price. This generates a welfare gain for U.S. consumers, valued as consumer surplus (CS). We follow a standard-equilibrium approach using demand elasticity and a trapezoidal approximation of the welfare change.
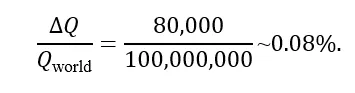
Step 1 – Incremental supply and induced price change
At plateau, Kaskida produces 80,000 bbl/day. Global liquids production is around 100 million bbl/day (EIA, 2024), so Kaskida’s share of world supply is:
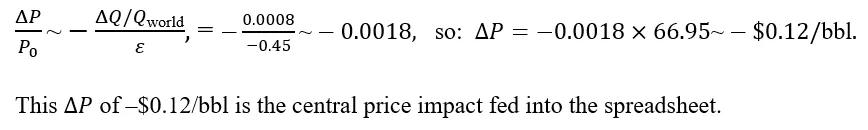
We adopt a crude oil price elasticity of demand ε = -.045, which lies toward the upper end of long-run elasticities reported in meta-analyses of world oil demand (Uría-Martínez et al., 2018). Approximating the percentage price change from the elasticity relation and using a baseline Brent price P0 of ⁓$66.95/"bbl”, consistent with EIA forecasts for mid-2020s Brent in the mid-$60s range, gives:
Step 2 – Affected U.S. consumption volume
Total U.S. petroleum consumption has been around 20.1 million bbl/day in recent years (EIA, 2023; EIA, 2025). For the central CS calculation, we treat this as the relevant demand volume affected by the marginal change in the world oil price; adjustments for the share of products directly linked to crude prices and residency of beneficiaries are captured in the model as separate scaling factors.
Step 3 – Trapezoid formula and worked calculation
Under a linear–demand approximation, the annual gain in consumer surplus from a small price change can be approximated by the area of a trapezoid:
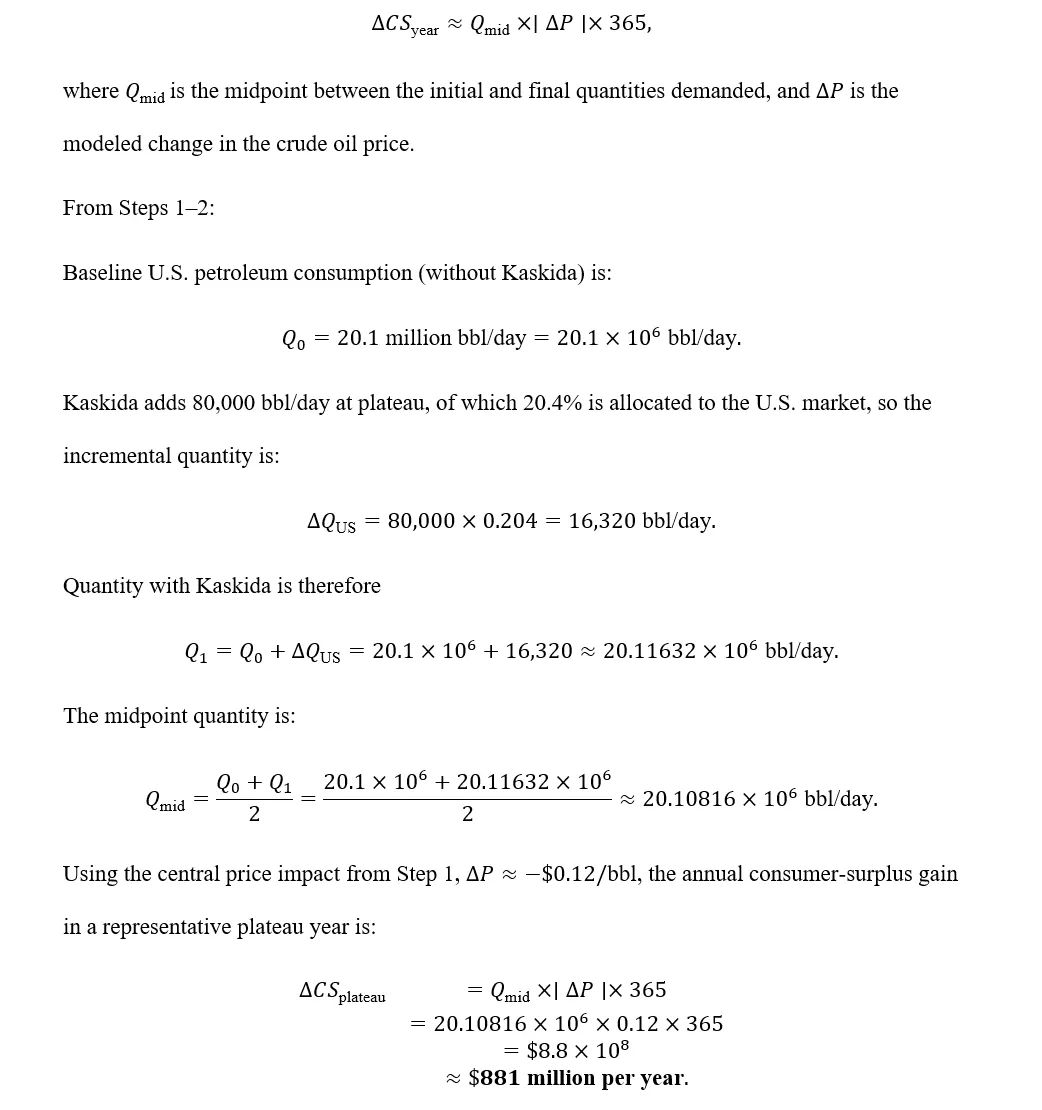
This value is the central consumer-surplus benefit used for each plateau year in the DCF model (with ramp-up and decline years scaled accordingly).
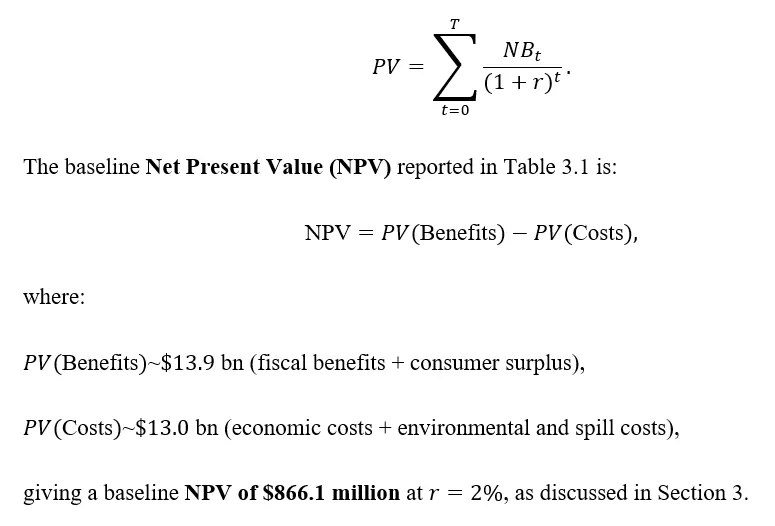
2.2.3 Discounting
All costs and benefits are modelled in real 2025 USD r=2% and discounted using a constant real social discount rate in the baseline. This choice is consistent with recent U.S. Office of Management and Budget (OMB) guidance, which emphasizes lower real discount rates (around 1–3%) for intergenerational and long-lived public projects, complementing the higher capital-market–based rates in earlier versions of Circular A-94 (OMB, 2023; Mannix, 2020).
For any stream of net benefits NBt, the present value is:
2.2 Risk Analysis
2.2.1 Sensitivity framework
We evaluate discount-rate sensitivity by varying the social discount rate across a 0–10% interval, consistent with federal CBA practice for long-lived infrastructure. This identifies how alternative policy environments—from near-risk-free evaluation to high-discount regimes reflecting regulatory, climate-policy, or macroeconomic uncertainty—affect project valuation. The resulting break-even discount rate marks the point at which discounted benefits exactly offset costs and serves as a key benchmark for determining whether Kaskida remains socially beneficial under differing discounting philosophies.
Subsequently, we apply deterministic sensitivity analysis to understand how variations in individual inputs affect the Kaskida project’s NPV before moving to the full Monte Carlo simulation. Each parameter—Brent price, plateau duration, decline rate, federal royalty rate, corporate tax rate, taxable profit share accruing domestically, and project-induced change in global oil prices (ΔP)—is varied independently between the same low, mode, and high bounds later used in the Monte Carlo model. These ranges are empirically grounded and fully justified in Section 4.3.1, allowing the tornado analysis to directly reflect the same uncertainty of space as the probabilistic results. By holding all other variables constant when a single input is shocked, we isolate that parameter’s marginal effect on NPV and rank its importance based on the size of the resulting NPV swing.
2.2.2 Monte Carlo Setup
To incorporate parameter uncertainty into our analysis, we employ a Monte Carlo simulation that randomly samples key economic and technical variables rather than relying solely on fixed-point estimates. Each uncertain input outlined in section 2.3.1 is assigned a modified PERT-Beta distribution using low, mode, and high values informed by historical data, industry benchmarks, and fiscal studies.
For each variable, the PERT shape parameters are computed as:
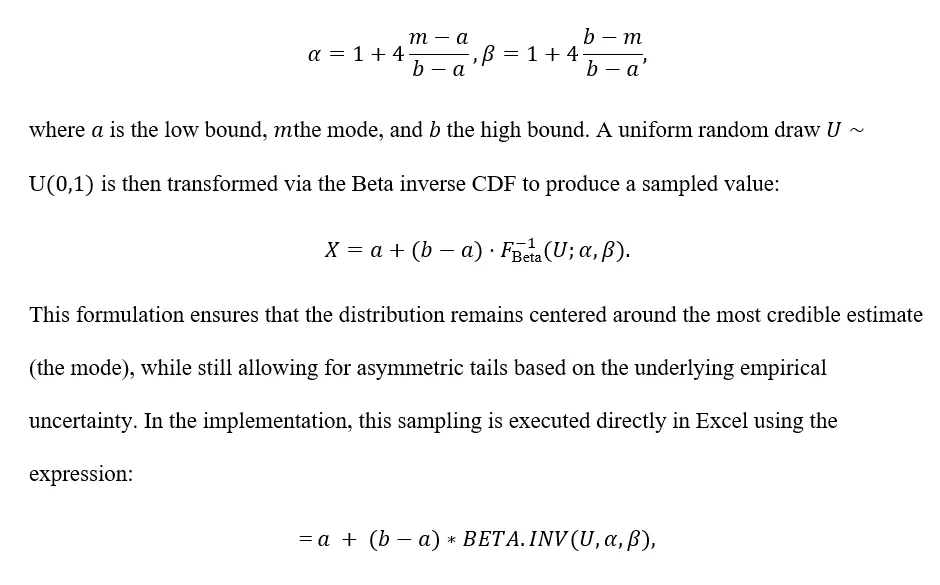
For each of the 10,000 iterations, the model draws a value from each distribution and recalculates annual net benefits and the resulting NPV. This produces a full probability distribution of project outcomes and forms the basis for the risk analysis presented in Section 4.3.
3. Baseline Results and Analysis
Table 3.1 summarizes the baseline discounted cash flow results for the Kaskida Offshore Development. Under the central assumptions—Brent price of $66.95/bbl, a 10-year production plateau, a 12% decline rate, federal royalty obligations, and a 2% social discount rate—the project yields a Net Present Value (NPV) of approximately $866 million, indicating that expected benefits exceed costs under standard evaluation criteria.
Section 3.2 breaks down the relative contributions of the various costs and benefits to the overall project NPV.
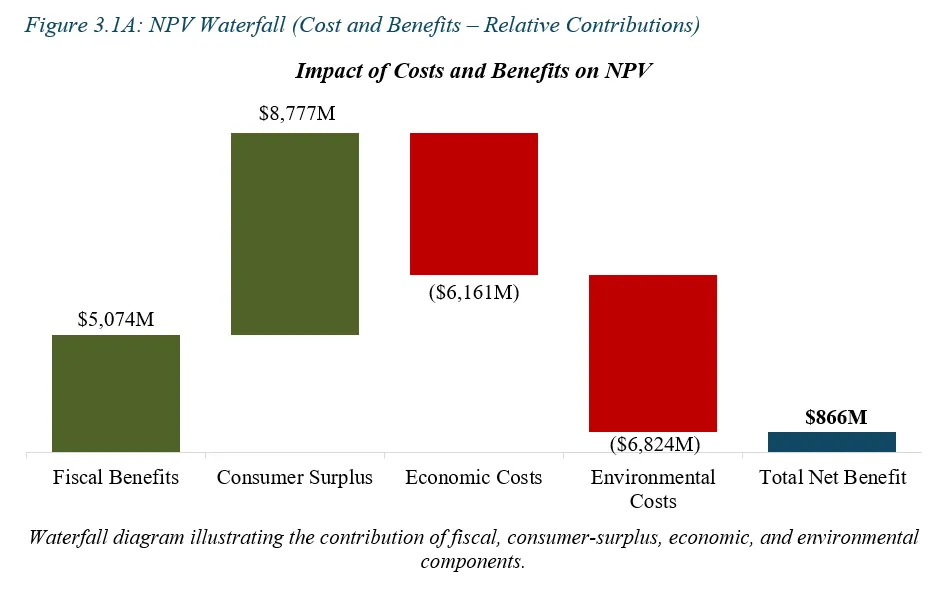
3.1 Distribution of Benefits and Costs
Figure 3.1A decomposes the baseline NPV by impact category. The largest sources of value are consumer surplus gains ($8.8 billion)—generated by reduced reliance on imported crude and associated price effects for U.S. consumers—and fiscal revenues ($5.1 billion) arising from royalty payments, corporate taxation and profit-sharing. Together, these benefits total approximately $13.9 billion in present value, forming the core economic justification for project development.
On the cost side, the largest single burden arises from environmental costs, valued at approximately $6.8 billion, which capture the monetized impact of lifecycle emissions and spill-related risk. Economic costs, totaling roughly $6.2 billion—including capital expenditure, operating expenditure, and decommissioning activities—also represent a substantial component of the project’s cost structure. While both cost categories are material, they are partially offset by the scale of fiscal transfers and consumer welfare gains.
Under the counterfactual of leaving the field undeveloped, net benefits are zero, so the project’s $866 million NPV represents the full incremental social value attributable to development. Therefore, under the defined standing and central assumptions, developing Kaskida yields greater net social value than the counterfactual of leaving the field undeveloped.
4. Risk and Uncertainty Analysis
4.1 Discount-Rate Sensitivity
Discount rates are varied because the present value of long-lived upstream revenue streams is highly sensitive to discounting assumptions. Figure 4.1 demonstrates how the Kaskida project’s NPV responds to variations in the social discount rate over a 0–10% interval. This range reflects conditions typically applied in public-sector CBAs: 0% represents a near–risk-free, long-horizon evaluation where society places full value on future consumer-surplus and fiscal benefits. Under this case, the project’s NPV reaches approximately $1.7 billion, representing the undiscounted present value of all net benefits across the multi-decade production horizon. Such a low discount rate is consistent with economic environments characterized by stable long-run oil demand, low macroeconomic risk, and confidence in the persistence of long-term public benefits.
The base-case discount rate of 2%, aligned with U.S. federal CBA guidance for long-lived public infrastructure, yields an NPV of $866.1 million. Rates in the 3–5% range represent more realistic policy environments in which intertemporal preferences, opportunity costs of capital, and regulatory uncertainty play a larger role. These scenarios capture conditions such as tighter climate-related fiscal policies, increased scrutiny of offshore developments, higher government borrowing costs, or an elevated federal shadow price of capital. Importantly, at a discount rate of 4.77%, the net present value reaches zero—the break-even point at which discounted benefits exactly offset discounted costs.
At the upper-bound stress case of 10%, the project’s value falls to approximately –$1 billion, reflecting a high-discount environment where long-term benefits such as consumer surplus and sustained fiscal revenues contribute minimally to present value. This scenario corresponds to conditions featuring heightened regulatory risk (e.g., accelerated decarbonization policy making offshore developments more uncertain), elevated private-sector discounting of long-run oil price benefits, or broader macroeconomic stress requiring a high social opportunity cost of capital. Overall, the curve declines smoothly and monotonically, illustrating that while Kaskida remains strongly net-positive under standard federal OMB Circular A-94 assumptions, its long-horizon benefits make it highly sensitive to discounting philosophy.
4.2 Tornado Sensitivity
This analysis identifies which parameters most strongly influence net benefits and therefore represent key sources of robustness risk. Each parameter is varied because its empirical uncertainty materially influences long-run price dynamics, reservoir recovery, or fiscal take, making these the key sources of valuation risk identified in offshore development studies: Oil prices affect both producer revenues and consumer welfare; plateau length and decline rates affect recoverable reserves; and fiscal parameters directly influence government take. These factors drive most of the project’s net benefits, so testing them is essential for assessing robustness. Figure 4.2 ranks the key drivers of project NPV by their marginal impact when each assumption is varied individually between its low and high values. The dominant driver is the price change induced by added domestic supply (ΔP), which generates an NPV swing of ⁓ ±$3.1 billion. This reflects the fact that even small movements in the national oil price scale across the entirety of U.S. consumption volumes, producing large changes in consumer surplus.
The reference Brent oil price is the second-largest driver, with an NPV swing of roughly ±$2.56 billion. As the core determinant of producer revenues and federal fiscal flows, long-run crude prices heavily shape project value. Fiscal parameters show notably smaller effects: variations in the deepwater royalty rate (⁓±$1.1 billion) and the Federal corporate income tax rate (⁓±$866 million) affect only the producer-side cash flows and therefore contribute less overall variance than price-driven consumer surplus changes. The taxable profit share accruing domestically exhibits the smallest marginal impact, consistent with its narrower empirical range and limited leverage on total benefits.
The parameter ranges used in this tornado analysis are identical to those employed in the Monte Carlo simulation, and their empirical justification is provided in Section 4.3.1.
4.3 Monte Carlo Analysis
A stochastic approach is appropriate because multiple uncertain inputs jointly influence net benefits and closed-form sensitivity is insufficient. Hence, to assess how uncertainty in key assumptions affects the economic viability of the Kaskida Offshore Development, we conducted a Monte Carlo simulation with 10,000 trials All uncertain parameters in the Monte Carlo simulation are modeled using PERT-Beta distributions calibrated to their low, mode, and high values.
The simulated parameters—real Brent crude prices, plateau duration, reservoir decline rates, Federal royalty and tax rates, the share of project profits taxable in the United States, and the project-induced change in global oil prices—were selected because they capture the major sources of market and fiscal uncertainty that materially affect net benefits.
Highly speculative or non-parameterizable factors—such as geopolitical supply shocks, extraordinary regulatory interventions, or long-run structural shifts in oil demand—are intentionally excluded, as they would require ranges too broad to yield meaningful probabilistic results. By focusing on empirically defensible uncertainties, the Monte Carlo framework provides a clear indication of how sensitive the project’s NPV is to fundamentals most likely to vary over the project horizon.
4.3.1 Inputs: Rationale and justification
The main parameters and distributional assumptions used in the simulation are outlined in Table 4.3.1.
Real Brent oil price
Historical real Brent prices typically fluctuate in the $50–$90/bbl range, apart from short-lived shocks. Long-run datasets show clustering in the mid-60s to mid-70s, justifying the $66.95 mode (EIA, 2025). The $50 low represents oversupply conditions such as 2015–16, while $90 reflects a tight-market scenario without assuming extreme geopolitical spikes (World Bank, 2025).
Plateau Duration
Deepwater projects typically maintain peak output for 5–15 years, depending on reservoir quality and drilling strategy. Industry analyses and BOEM development profiles place typical plateaus around a decade for large offshore deepwater fields (SPE, 2025). Thus, 10 years is chosen as the mode, with 5 years representing conservative reservoir performance and 15 years an optimistic scenario with additional wells or enhanced recovery (BOEM, 2025).
Decline Rate after plateau
Global field-level data show that deepwater reservoirs often decline at rates around 10–11% per year after plateau due to high drawdown and reservoir complexity (IEA, 2025). Consequently, 12% is selected as the central figure. A lower rate (8%) indicates strong reservoir support or successful intervention, while a higher rate (15%) captures adverse depletion and limited pressure support (IEA, 2025).
Federal Royalty Rate
The standard royalty rate for federal deepwater leases in the Gulf of America is 18.75%, making it the mode value (BOEM, 2025). The lower bound of 15% reflects potential royalty relief or incentives aimed at stimulating investment, while 20% allows for moderate fiscal tightening within historically observed regimes (CRS, 2025).
Federal Corporate Tax Rate
The U.S. federal statutory corporate income tax rate is 21%, which serves as both the low and mode assumptions because it has remained unchanged since the Tax Cuts and Jobs Act of 2017 (TCJA, 2017). A high value of 25% reflects moderate fiscal tightening scenarios discussed in policy literature and aligns with historical federal corporate tax brackets prior to 2018, without assuming extreme or low-probability tax reforms (CBO, 2018).
Share of Profits Taxable in the U.S.
Comparative fiscal studies indicate total government take for offshore petroleum projects typically ranges from 40–60% of pretax net cash flows (BOEM, 2018). For U.S. Gulf projects operated by U.S.-incorporated firms, a 45% central estimate is appropriate. A lower 35% reflects higher foreign ownership or profit shifting, while 55% aligns with upper-bound fiscal capture seen in offshore regimes (Hallwood & Sinclair, 2007).
ΔP (Oil Price change from added domestic supply)
With Kaskida’s incremental output (~80 kbpd, ~0.08% of global supply) and using a short-run supply elasticity of approximately 0.453, the central estimate is a price impact of –$0.12/bbl. The low end (–$0.09/bbl) reflects a weaker response to supply changes or offsetting producer behavior, while the high end (–$0.15/bbl) captures tighter market conditions where marginal production exerts stronger downward pressure (Hamilton, J.D., 2009).
All variables are simulated independently due to lack of evidence of systematic cross-correlation in available data.
4.3.2 Outputs
As shown in Table 4.3.2, the Monte Carlo simulation yields an NPV distribution with a mean of approximately $928M and a median of $926M, indicating only mild right-tail skew. The spread between the tenth-percentile outcome (P₁₀ = –$375M) and the ninetieth-percentile outcome (P₉₀ = $2.25B) illustrates that although downside outcomes exist, the upper tail dominates, driven by uncertainty in long-run oil prices and the taxable share of project profits.
Downside risk is material: the 5% Value-at-Risk (VaR) is –$713M, and the expected shortfall of the worst 5% of cases averages –$1.09B, reflecting scenarios where low oil prices, faster-than-expected decline rates, and reduced fiscal capture coincide. Nevertheless, the project remains net-positive in 81.5% of simulations, indicating that core fundamentals—consumer surplus gains and federal fiscal revenues—anchor the distribution well above zero under most plausible conditions.
5. Conclusions
This Cost–Benefit Analysis finds that the Kaskida offshore development delivers a positive net benefit for the United States, driven by strong fiscal revenues and meaningful consumer-surplus gains that outweigh substantial environmental and operating costs. Under the central assumptions—Brent price of $66.95/bbl, a 10-year plateau, a 12% decline rate, statutory royalty and tax obligations, and a 2% social discount rate—the project achieves an NPV of approximately $866 million (2025 USD).
The largest sources of benefit are consumer-surplus gains generated by modest reductions in crude-oil prices from Kaskida’s incremental supply and federal fiscal revenues (royalties, corporate income taxes, and profit-sharing). Major costs include lifecycle CO₂ emissions, capital and operating expenditures, and a scaled spill-risk proxy. While environmental damages are significant, the combined fiscal and welfare gains offset them in present-value terms.
Sensitivity analysis shows the results are reasonably robust: NPV remains positive until roughly 4.77%, and Monte Carlo simulations indicate the project is net-positive in 81.5% of trials, with downside cases driven mainly by unusually low oil prices or compressed fiscal capture.
5.1 Limitations
Despite strong results, several limitations should be acknowledged:
5.1.1 Partial-equilibrium consumer-surplus modelling
The CS calculation uses a reduced-form elasticity model and linear demand approximation. While appropriate for marginal supply shocks, it does not account for dynamic market responses, substitution with other crude grades, or potential global feedback loops.
5.1.2 Bias of excluded elements
Excluding labor-market spillovers and macroeconomic multipliers likely understates benefits modestly, while excluding chronic ecological impacts may understate costs. Because these forces operate in opposite directions, their net effect is likely small relative to the $866M NPV baseline.
5.1.3 Emissions monetization uncertainties
Social cost of carbon (SCC) estimates vary widely across agencies and methodological choices. Using $236/tCO₂ is reasonable for 2025 USD but alternative assumptions could materially increase or decrease environmental cost estimates.
5.1.4 Spill-risk proxying from Deepwater Horizon
The spill-risk valuation uses a scaled Deepwater Horizon estimate, applying reservoir-size ratios and elasticity assumptions. Although conservative, this approach implicitly assumes that catastrophic blowout costs scale smoothly with reservoir characteristics, which may not hold under all engineering or regulatory scenarios.
5.1.5 Upstream price and production uncertainties
Brent price projections, decline rates, and plateau duration carry inherent uncertainty. The PERT-Beta distributions in the Monte Carlo analysis help capture variability, but extreme price shocks or regulatory interventions are intentionally excluded to avoid speculative modeling.
5.1.6 Standing and benefit allocation
The model applies a U.S. standing that captures fiscal flows and consumer surplus but excludes secondary macroeconomic spillovers, labor-market impacts, and international welfare effects. These broader impacts—positive or negative—are outside the scope of this CBA.
5.2 Next Steps and Future Work
Enhancing this valuation in future work would benefit from the following areas of expansion:
5.2.1 Dynamic equilibrium modelling of global oil markets
Incorporating an energy-sector general equilibrium model (e.g., using NEMS or a structural VAR approach) would capture interactions among global supply, OPEC response behavior, refinery adjustments, and trade patterns. This would refine both the ΔP estimate and associated consumer-surplus impacts.
5.2.2 Engineering-based environmental risk assessment
A detailed fault-tree or event-tree analysis incorporating site-specific blowout probabilities, BOP failure rates, and well-control design could replace the scaled Deepwater Horizon proxy, lowering uncertainty in spill-risk modelling.
5.2.3 Lifecycle GHG and social-cost modelling
A more granular emissions inventory—covering drilling, vessel traffic, flaring, pipeline transport, and end-use combustion—paired with probabilistic SCC estimates would refine environmental cost valuation.
5.3 Final Assessment and Recommendation
The baseline analysis and supporting robustness checks indicate that Kaskida is economically viable and resilient to key uncertainties, offering a substantive contribution to U.S. energy security and federal revenue generation. Even after accounting for greenhouse-gas emissions, spill risk, and substantial capital and operating costs, the project delivers positive net economic value. While uncertainty is inherent in long-horizon offshore developments, the project’s core value drivers—consumer welfare gains from modestly lower crude prices, federal royalty and tax revenues, and stable long-run output—provide a durable foundation for economic viability.
Provided that appropriate regulatory oversight, environmental monitoring, operational safeguards, and decommissioning mitigation are rigorously enforced, we recommend proceeding with the Kaskida development. Under the assumptions and standing applied in this CBA, the project is positioned to offer net-positive outcomes for U.S. society.
References
Agalliu, I. (2018). Comparative analysis of U.S. fiscal systems. BOEM / IHS Markit.
BOEM (2020). Recommended Special Case Royalty Relief Discount Rate for Deep Subsea Tieback Projects. Bureau of Ocean Energy Management.
BOEM (2025a). Federal offshore royalty terms – deepwater leases. Bureau of Ocean Energy Management.
BOEM (2025b). Gulf of Mexico deepwater development reports. Bureau of Ocean Energy Management.
BP Press. (2024, July 30). BP gives go-ahead for sixth operated hub, Kaskida, in the US Gulf of Mexico. https://www.bp.com/en/global/corporate/news-and-insights/press-releases/bp-gives-go-ahead-for-sixth-operated-hub-kaskida-in-the-us-gulf-of-mexico.html
CBO (2018). Federal revenue options. Congressional Budget Office.
Cost of Carbon. (2024). Calculating the Social Cost of Greenhouse Gases. Transition Pathway Initiative, London School of Economics.
CRS (2025). Offshore leasing and royalty relief history. Congressional Research Service.
EIA (2023). Oil and petroleum products explained – Use of oil. U.S. Energy Information Administration.
EIA (2024). How much oil is consumed in the United States? U.S. Energy Information Administration FAQ.
EIA (2025). Spot prices for crude oil and petroleum products. U.S. Energy Information Administration.
EPA (2023). Report on the Social Cost of Greenhouse Gases: Estimates Incorporating Recent Scientific Advances. U.S. Environmental Protection Agency.
Hallwood, P. & Sinclair, R. (2007). Rent Sharing and Offshore Fiscal Regimes. (Original publication details not provided; academic monograph). Palgrave Macmillan.
Hamilton, J.D. (2009). ‘Causes and consequences of the oil shock of 2007–08’. Brookings Papers on Economic Activity, 2009(1), 215–259.
IEA (2025). World Energy Outlook: Field decline analysis. International Energy Agency.
Mannix, B.F. (2020). The Discounting Dilemma: Circular A-4 and Discount Rates in Regulatory Analysis. GWU Regulatory Studies Center.
Merrow, E.W. (2011). Industrial Megaprojects: Concepts, Strategies, and Practices for Success. Wiley. Hoboken, NJ
National Commission on the BP Deepwater Horizon Oil Spill and Offshore Drilling. (2011). Deep Water: The Gulf Oil Disaster and the Future of Offshore Drilling. U.S. Government Printing Office.
NOIA (2023). Gulf of Mexico Energy Outlook 2023. National Ocean Industries Association.
NORSOK (2013). NORSOK Z-016: Cost Estimation for Projects. Standards Norway, Lysaker.
Office of Management and Budget (OMB) (2023). Circular A-94: Guidelines and Discount Rates for Benefit–Cost Analysis. Washington, D.C.
OGA (2018). UKCS Project Delivery Review 2018. UK Oil & Gas Authority, London
Perkins, R. & Spencer, S. (2024, July 30). BP takes FID on Kaskida Oil Project in US Gulf of Mexico. S&P Global Commodity Insights.
PwC (2025). United States – Corporate: Taxes on corporate income. PwC Worldwide Tax Summaries.
Reuters (2018). BP Deepwater Horizon costs balloon to $65 billion. Reuters Business News.
Reuters (2025). EIA raises US oil production forecast, says oversupply will weigh on prices. Reuters Energy.
SPE (2025). Offshore production profiles. Society of Petroleum Engineers, Richardson, TX.
TCJA (2017). Tax Cuts and Jobs Act of 2017. Public Law No. 115-97.
Uría-Martínez, R. et al. (2018). Using Meta-Analysis to Estimate World Oil Demand Elasticity. NHTSA Technical Exhibit.
World Bank (2025). Commodity price data (“Pink Sheet”). World Bank Group.
Appendix
Appendix A: Baseline Results
Table 3.1: Baseline Net Present Value (NPV) and Associated Parameters
Main outputs of the baseline DCF model, including BCR, PV of costs and benefits, discount rate, and horizon.
Appendix B: Sensitivity Analysis
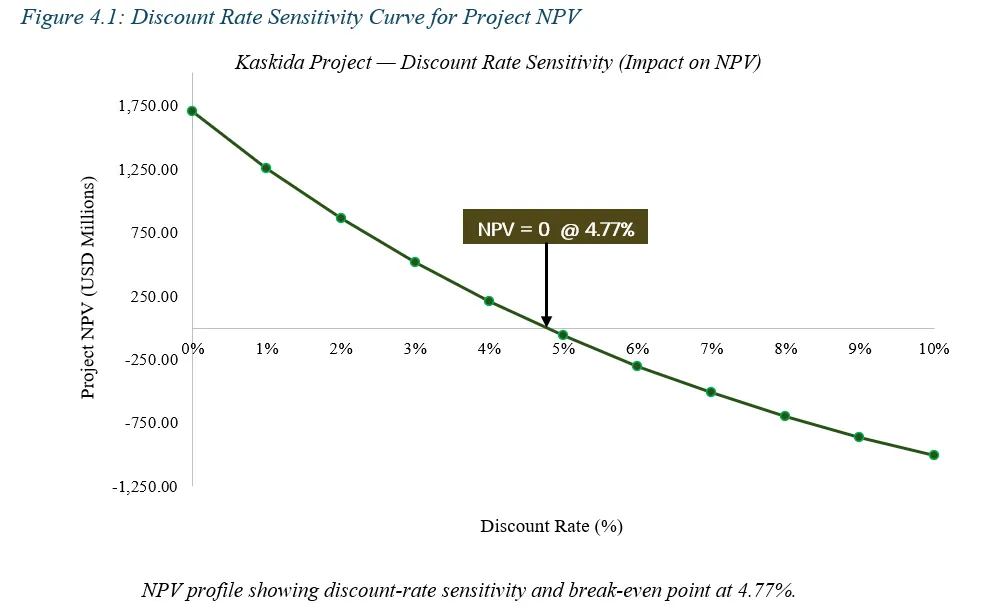
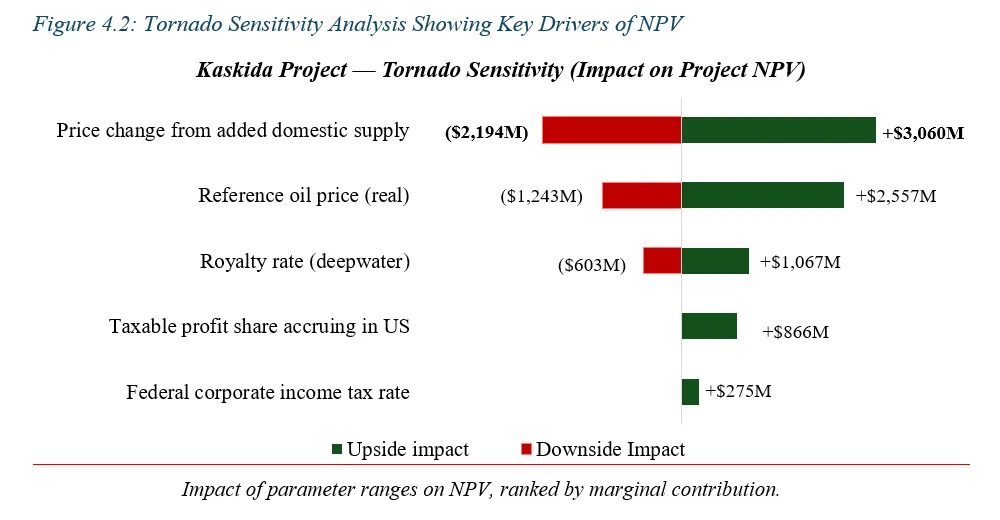
Table 4.3.1: Summary of Key Variables, Distributions & Parameters Used for Monte Carlo Analysis
Table 4.3.2: Summary of Key outputs from Monte Carlo Analysis